Basic Web Skills: Dev Tools
This post covers Dev Tools and other simple ways of gathering basic info about a website. If you are brand-new to web applications, this post is for you. If you’re trying out your first CTF and trying to do some beginner web challenges, this is also for you.
🔍 Inspect Source
Funny enough, this post was written right after the governor of Missouri got Big Mad because someone right-clicked and chose View Page Source on a website.
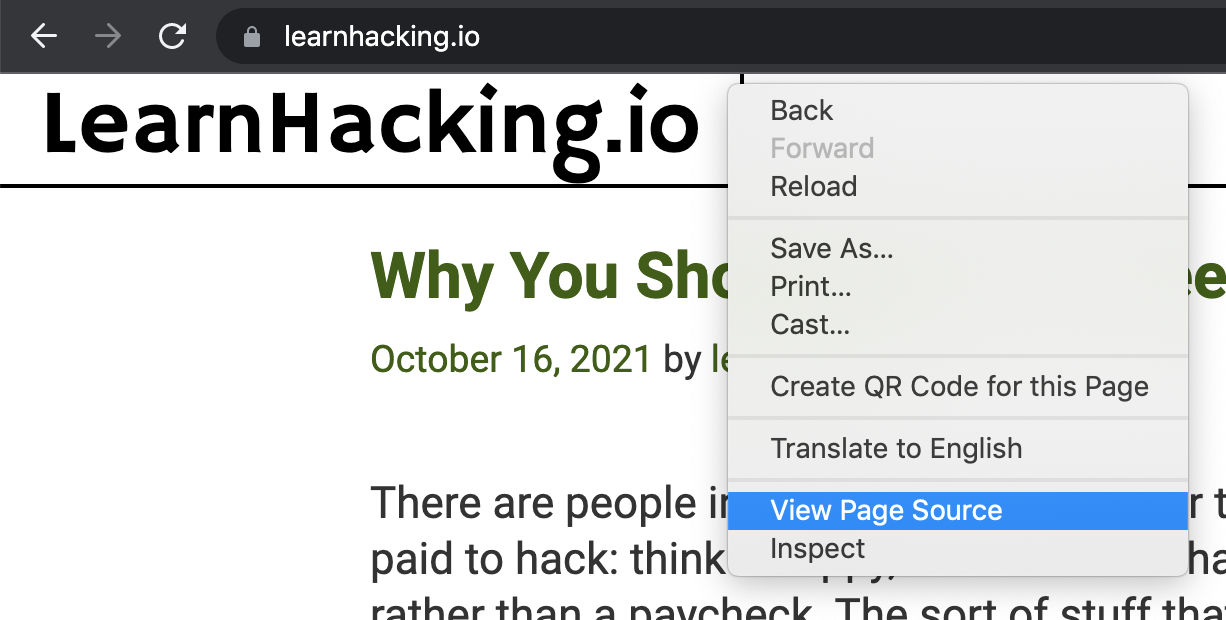
If you were to right-click and view page source on this site, you’d see something like:
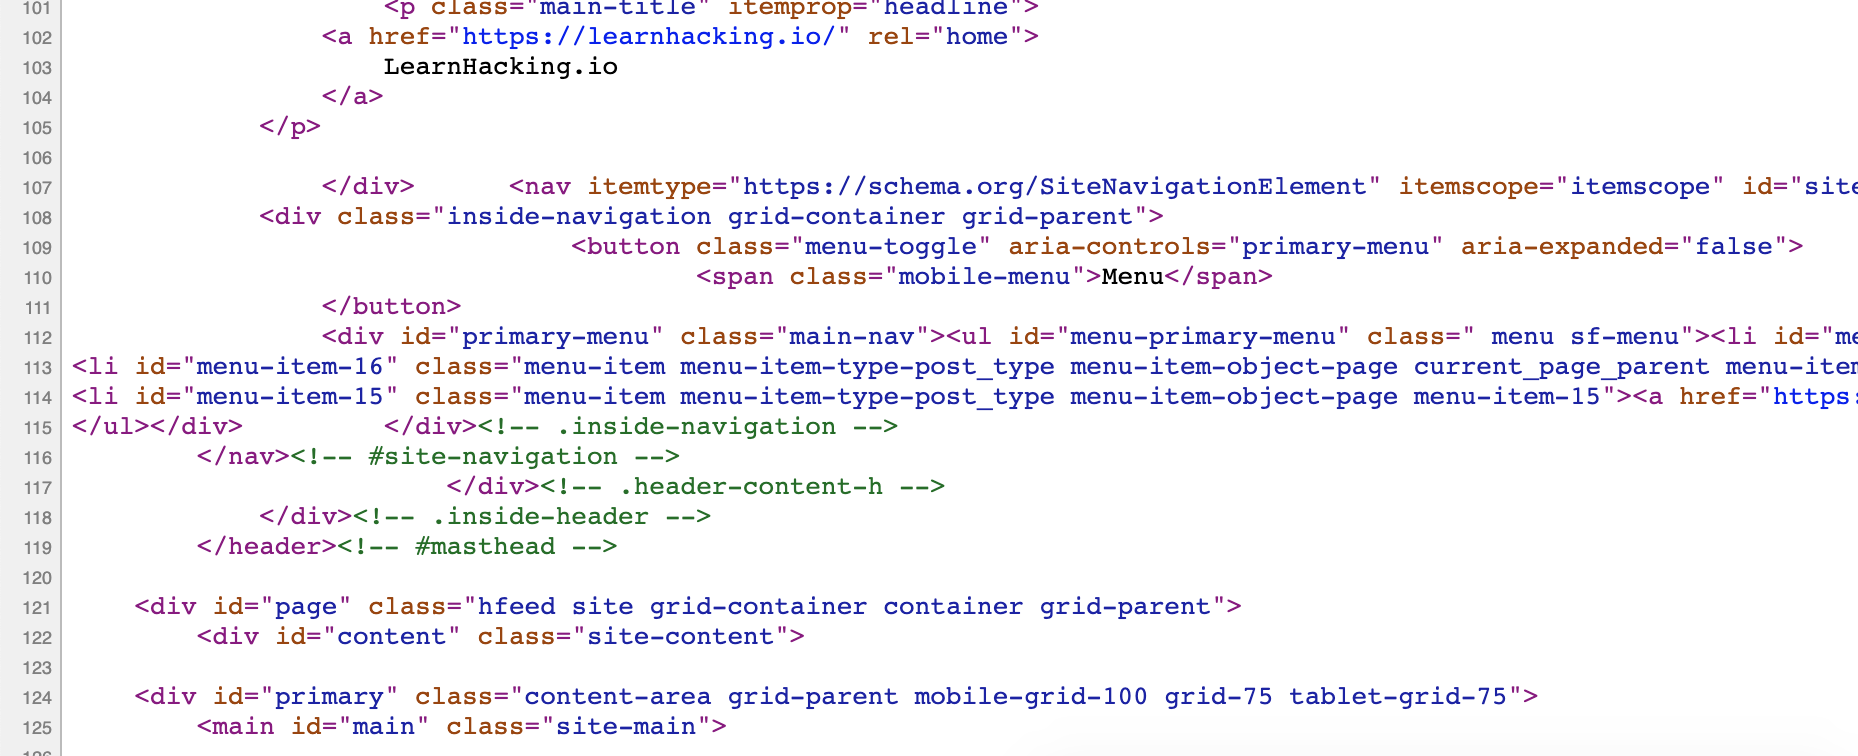
What you’re looking at is the HTML source of the website, which tells your browser how to render the web page. If this is completely foreign to you, it will greatly benefit you to take some time (at least an hour or two) and try a basic HTML course. Here is a free option from Codecademy. Or check out this hour-long video crash course.
But wait a minute, if HTML is what the browser uses to render the page, what do I gain by looking at the source? Isn’t that redundant with the rendered page?
Not always.
- Sometimes you’ll see commented-out links to other pages you wouldn’t see otherwise. This is especially true if the developer team doesn’t have good version control; they might opt to comment out links/code temporarily instead of have stored copies of their older cold.
- You might also see other comments and TODOs if the web developer is sloppy.
- Lastly, you might see some build information or artifacts that hint at what frameworks, technologies, etc were used to build the website (fingers crossed for you that it’s something vulnerable!)
Finding interesting things in the HTML page source is more CTF than real-life (although I have found credentials in HTML comments before). And, you can automate the process of finding interesting info with tools like Burp Suite or Wappalyzer. But it’s still a good place to start.
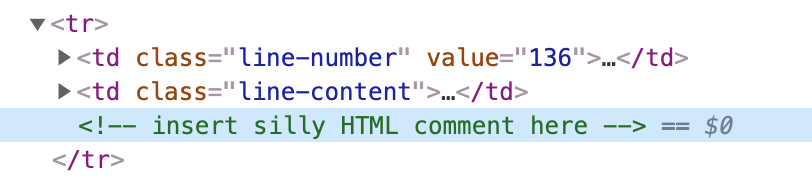
📦 Elements
This is another way of viewing HTML content. If you right-click on a webpage and select “Inspect”.
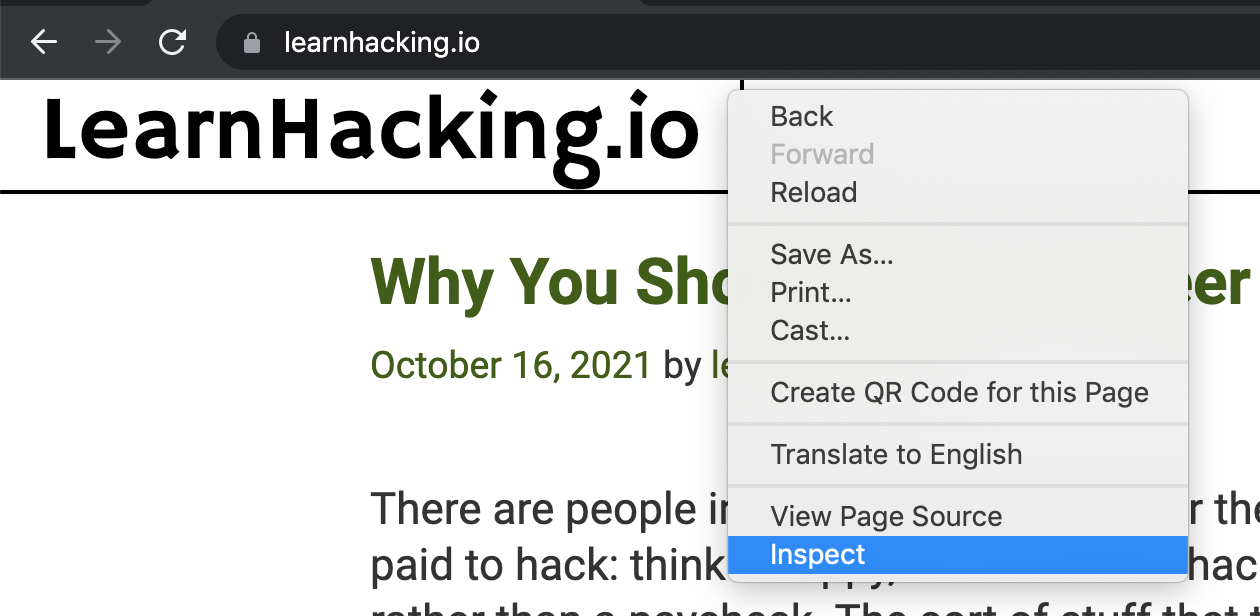
This will open up a sidebar in your browser.
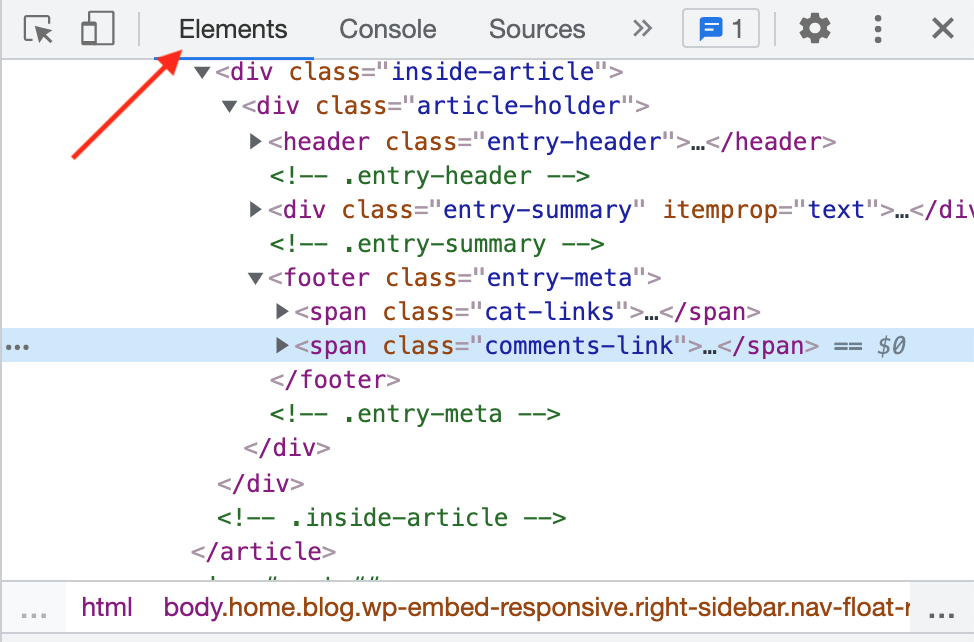
This is a different way of viewing the HTML content where you can open/collapse different HTML tags. Additionally, if you are looking at a website that uses a Javascript framework like React to dynamically change the content of the webpage, View Page Source might only show you the loading view. You’ll need to check out Dev Tools instead.
Same rules apply here, look for comments, hints at the technologies in use, and other useful information that isn’t being rendered by your browser.
📑 Sources
HTML files can include other files and resources. Common examples include CSS stylesheets (so your website doesn’t look ugly), and Javascript (so it can do cool interactive things and/or sell your data). But this list also includes fonts, images, videos, other HTML, PHP, etc. files and so on.
Dev Tools shows you these files and resources individually. Right-click and select “Inspect” (or hit the F12 key) and then select the Sources tab:
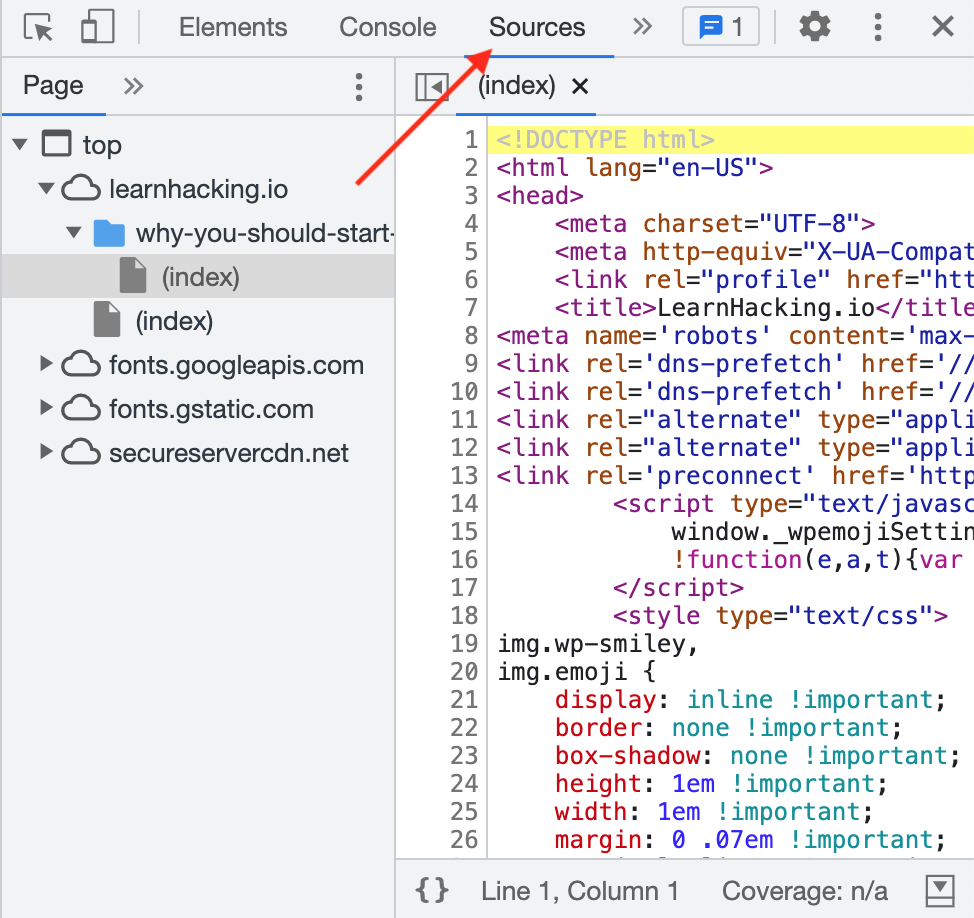
Again, using Burp Suite or another tool can help organize all of this information for you. But if you’re doing it manually, this view can be helpful for showing files in their entirety, and showing files you may have missed in other views (especially if it’s a resource-heavy website).
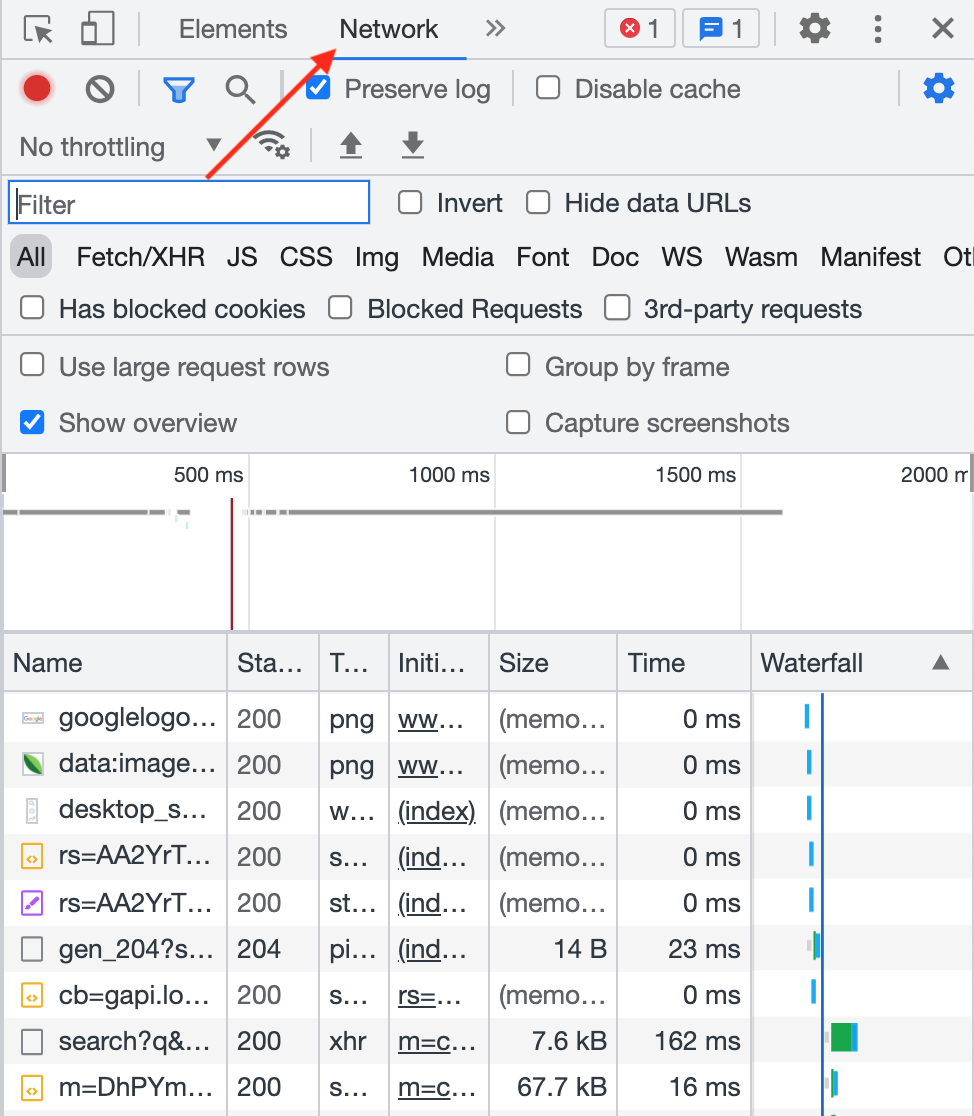
📞 Network
If these files and resources are being shown to you in your browser, they have to come from somewhere, right?
If you want information on where they’re coming from, click the Network tab (after opening up Dev Tools through right-click -> Inspect, or hit F12).
Refresh the page and you should see all the resources from the Sources view show up.
Click into one of them and view headers. These are of interest to you because they give information like where the files are coming from; additional data that is received but not displayed to the end user; information about the server (either directly through a server: header or through unusual, server-specific headers); content security policy; accepted encodings and more. If you submit data through a form, you can see what is being sent as a POST request.
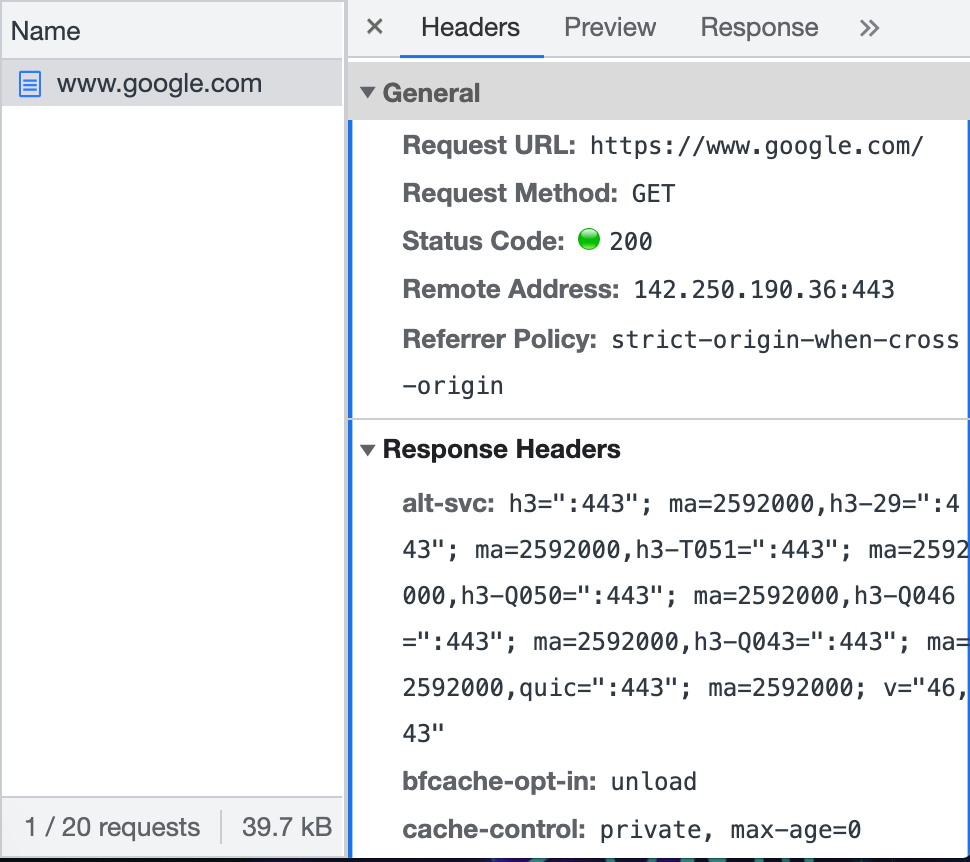
If you want to alter these headers, you’ll need to use curl, Burp Suite, Postman, or a similar tool.
You can also right-click one of these requests and select “copy as cURL command” for command line usage.
📝 Console
Open up Dev Tools (right-click page and Inspect or hit F12) and select the Console tab. This is where Javascript debugging messages are shown and errors and warnings are logged.
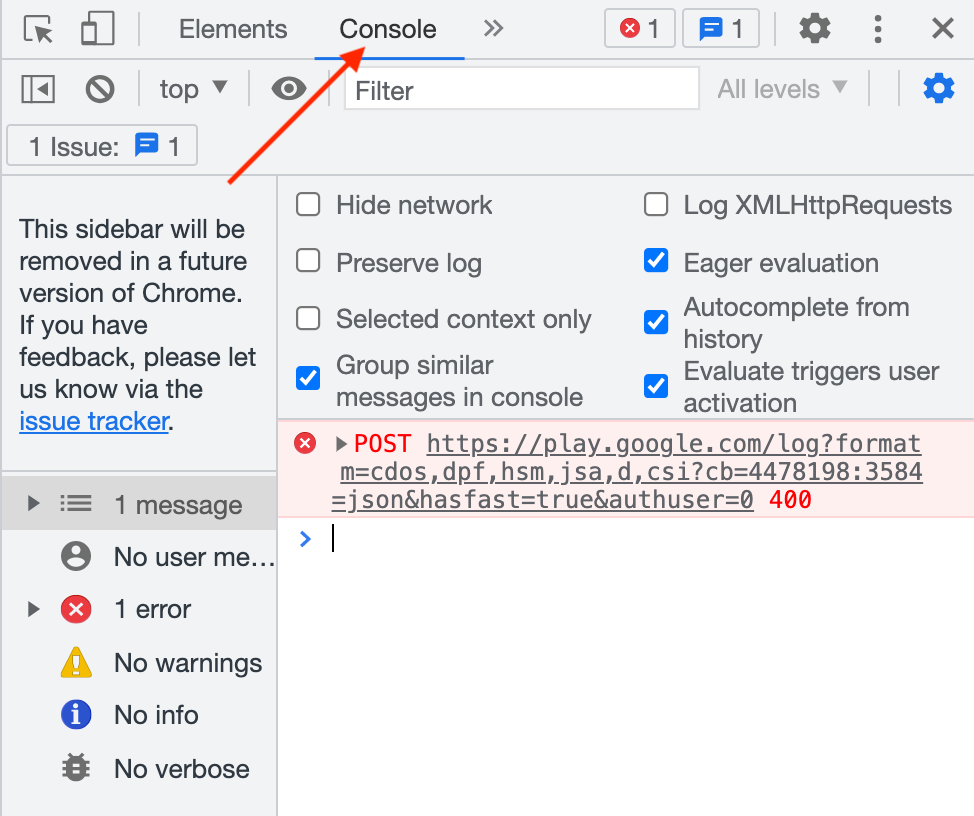
You might need to refresh the page after you open the console, as any messages sent before opening it won’t be shown.
What to look for: is the website logging console messages that should have been taken out in production? Are you seeing errors from incorrect implementations? This is also where you want to look if your XSS attempts are being blocked by Content Security Policies.
🍪 Application (Cookies)
Last but not least (for this blog post, anyway) is the Application tab. This shows a bunch of browser storage views.
Note: If you’re using Firefox, you’ll need to look at the Storage tab for this part.
Local storage and session storage may also be of interest to you, but for basic CTFs and tasks like inspecting and modifying cookies, click the Cookies sidebar option, then the website that is relevant to you.
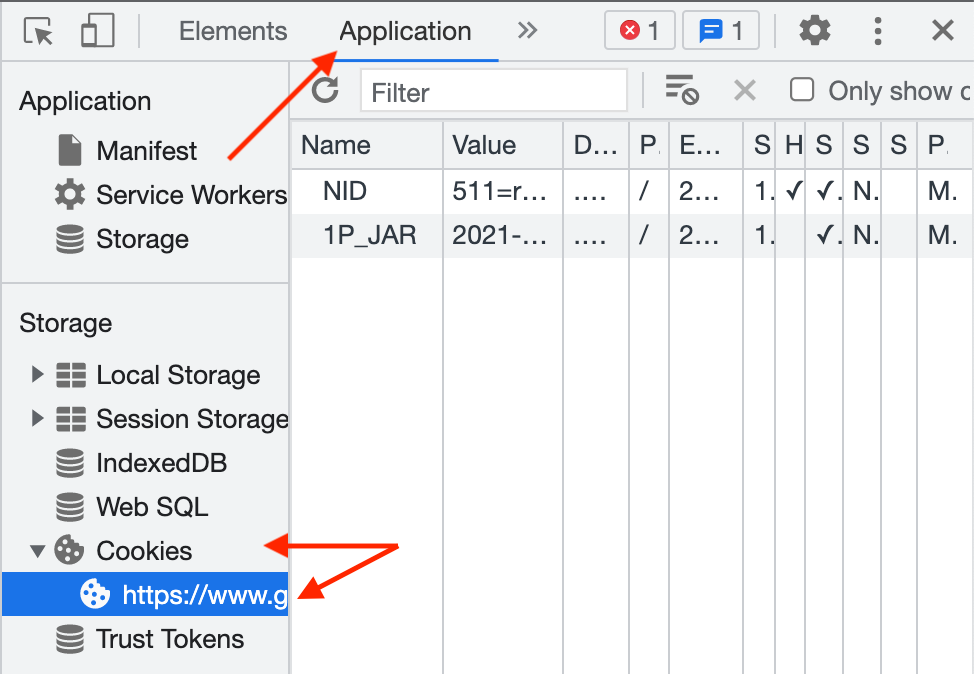
You’ll be able to view cookie information, including path, value, and expiry, and change any of those values.
Try It Out
First of all, you can try this on different websites, such as Google, your own blog, and other sites you might frequent.
To try these concepts out with security skills in mind, check out beginner web challenges in CTFs. Since this is more on the beginner side, you likely won’t find standalone resources to test these skills.
But you can try PicoCTF by going to https://play.picoctf.org/ and doing the following challenges:
- Insp3ct0r
- dont-use-client-side
- Scavenger Hunt
- Cookies